


Economic Indicators Turn from Confusing to Ominous
Either there will be a recession or major economic principles have somehow been falsified in the past two years. I think that we are seeing the downturn just ahead and may in fact already be in one.

[There’s a little bit of history behind this article: I wrote this item a week ago for my weekly Life, Liberty, Property newsletter for The Heartland Institute, which was sent out last Monday. (I have updated it for the article you are now reading.) This Wednesday, I boiled the newsletter item down into an oped for the American Thinker, which ran on Thursday. (I wrote another op-ed based on this item, which will appear shortly.) On Friday, my observations were proven (sadly) true as the national jobs report showed employment slowing and the stock market tumbled.]
While the stock markets headed down a week ago, the federal government reported second-quarter economic growth was much higher than expected, at a 2.8 percent annual rate, up from 1.4 percent annualized in the first quarter. Stocks rose after the report, though the Nasdaq and S&P 500 remained negative for the week.
The Wall Street Journal’s chart of the week’s trading eight days ago showed a “rough week,” as the accompanying story put it:
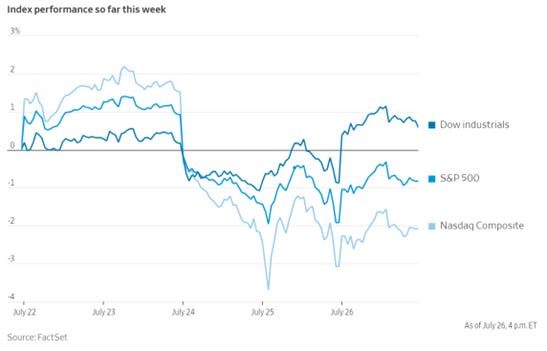
The plunge of the Nasdaq was particularly steep and disturbing, as that index had been doing exceptionally well.
The markets started to recover. Then, a week after that selloff, a disappointing jobs report set the stock markets tumbling yesterday.
The second quarter numbers were not as rosy as most analysts were suggesting. As economist and former Reagan administration budget director David Stockman notes, “$71 billion or 44% of the allegedly awesome $260 billion increase in Q2 real GDP consisted of a large inventory stocking gain. Real GDP excluding the inventory swing rose by only $89 billion or a pretty limpid 1.6% at an annualized rate.” Inventory stock is a volatile component that does not correspond well to overall economic trends and in fact often portends economic contraction when it rises.
The week’s events continued the pattern of inconsistent and contradictory indicators from the economy. This is based in great part on the widespread understanding that the Federal Reserve (Fed) has long been awaiting bad economic news before it will reduce interest rates and stimulate the economy. The Fed does not want to lower rates too early, lest it set off a new round of price inflation. Thus, the Fed refuses to reduce interest rates unless the economy shows higher unemployment, lower gross domestic product (GDP), stock market losses, and the like.
High interest rates are supposed to cause stock prices to fall. That has not been the case with the current round of rate increases, because inflation drives up asset prices. High interest rates are also supposed to increase unemployment, but they have not done so appreciably, thus far. That is because overall labor force participation is still well below the pre-pandemic norm, thus reducing the number of people seeking jobs:

Many economists have been predicting a recession for many months now in the wake of the rapid interest rate increases of March 2022 through July 2023, which the Fed has held steady ever since. To me, either there will be a recession or major economic principles have somehow been falsified in the past couple of years.
I think that we are seeing the downturn just ahead and may in fact already be in it. The problems were hidden by a tsunami of money.
The bizarre government actions perpetrated during the Covid pandemic distorted the economy greatly and created such strange conditions that restoration of normal cause-and-effect relationships has been exceedingly difficult. The supply disruptions, gigantic infusions of federal spending and helicopter money, enormous increase in consumer dollars spent on services, and other pandemic-related economic mischief grossly warped the price signals that enable markets to create the best possible allocation of goods and services across the economy. It is taking an unexpectedly long time for more-normal conditions to develop.
Such forced inefficiency must have negative effects on the nation’s production of goods and services. I believe that that is exactly what happened and is why the economic data have not made sense over the past couple of years.
Meanwhile, the Fed continues to assume the numbers do make sense and what we really need are a couple of months of higher unemployment and lower GDP or a stock market crash, and they can then cheerfully start lowering interest rates (albeit too slowly) and save the day … after everything has fallen into chaos.
Substack author Quoth the Raven (QtR) argues at his (excellent) Fringe Finance page that the Fed is playing a dangerous game, as I, too, have been saying for the past year and a half:
The cold hard fact is that two years of higher rates after 15 years of taking on debt at near-zero rates is eventually going to grind the gears of the economy to a halt. It’s as simple as math. Rates go up, cost of debt goes up, discretionary spending slows as a result of higher debt service, businesses generate less cash, layoffs happens and round and round we go, spiraling into a de-leveraging cycle.
In other words, this will have consequences. Try to act surprised when it happens, OK?

It’s only a question of how long it’s going to take to get there. My readers also know that I have been predicting this outcome for 18 months, while the stock market has done nothing but rocket higher. I underestimated how much liquidity there was in the economy and have been wrong on timing—though I don’t believe I’m wrong on outcome—for the past year or two.
QtR is pointing to the fact that economic fundamentals matter. Although it can be very difficult to filter out other highly important factors (liquidity in this case), policy actions will ultimately have their effects. In fact, sometimes those effects will turn out to be even greater, especially the damaging ones, when they finally manifest, because the fundamentals worsened while the problems were obscured by the positive indicators.
That may in fact be happening now, QtR writes: “macro data—which operates on a pretty significant lag—is starting to turn into ‘ugly’ territory, indicating that a true economic slowdown could already be taking place, just not showing up in the data yet.”
QtR cites an article by economist Peter St. Onge, of the Brownstone Institute and Heritage Foundation, that asks whether we are already in a recession. Figuring out what is really happening in the economy is a “herculean task,” St. Onge writes, because “every official economic number out there is broken.” That’s obviously important in itself, of course, but it is a massive problem now because “if the official numbers are wrong, it could mean we’re already in recession, masked by rising asset prices courtesy of the Fed.”
A major source of confusion, St. Onge writes, is that the way is inflation is calculated is highly complicated, has been changed over the years, and, I would add, might just be designed at least in part to diminish the proven inflationary effects of excessive government spending. If inflation is higher than the official numbers indicate, growth is less than we think, St. Onge notes:
To give a flavor, the official inflation rate since Covid has been around 21%. But fast food menu prices—a go-to indicator for foreign exchange investors—are up between 35% and 50%. People posting grocery receipts online say it’s actually more than 50%.
The problem is if inflation was actually, say, 35% it means GDP hasn’t gone up at all since pre-Covid. It means it actually went down. Implying we’ve been in recession for nearly 5 years.

This is because official growth numbers are discounted by inflation. If growth was 3% but inflation was 2%, we grew. If inflation was actually 4%, we shrank.
That means that if inflation was actually worse than 35%—if, say, it was the 50% that grocery receipts say—that would put us near Depression levels with a 13% drop in real GDP since pre-Covid.
That goes a long way toward explaining two things: why the public believes inflation is worse than the numbers indicate, and why the people believe the economy is weaker than economists and Biden apologists say it is. This chart from portfolio manager Michael W. Green shows how the recent run-up in inflation has required much more of the average household’s income be spent on necessities:
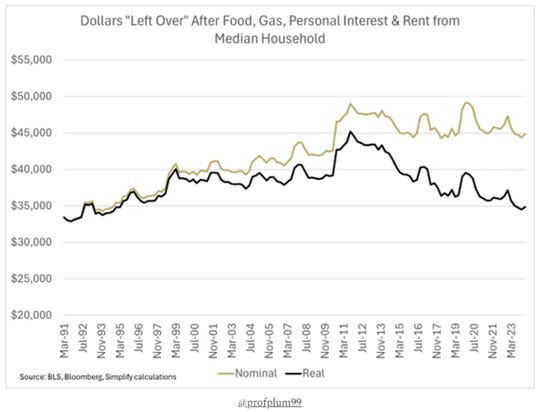
Source: Yes, I Give a Fig; h/t Daily Chartbook
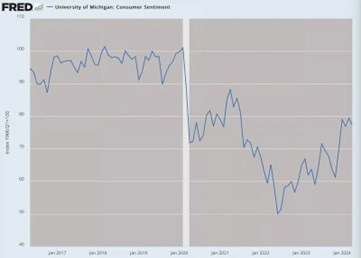
Consumer confidence is thus understandably far below where it was before the pandemic, as another chart from St. Onge illustrates:
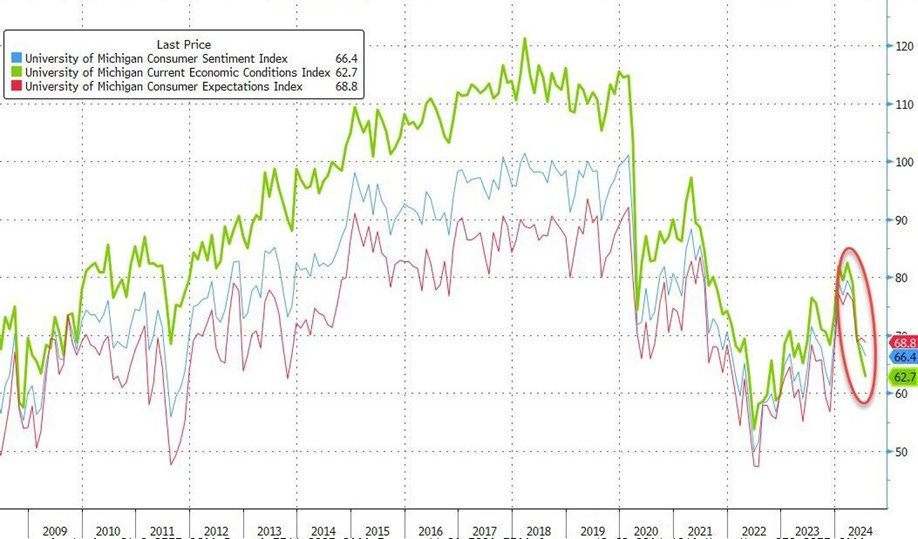
Consumer confidence has been falling rapidly in 2024 and is now at its weakest since December 2022, as this chart from ZeroHedge shows:
St. Onge cites multiple “data points and anecdotes” indicating economic weakness—observations of the sort that have regularly appeared in my Life, Liberty, Property email newsletter and have intensified in the past few months. Among these indicators are “Americans seeing McDonald’s as a luxury item, buying groceries on credit cards, selling off second cars, and downsizing to smaller homes—all hallmarks of a recession,” St. Onge writes.
St. Onge provides a chart showing the divergence of reported nominal-dollar retail sales, which suggest growth, from the real, inflation-adjusted numbers, which show a contraction since President Joe Biden took office and began rapidly increasing government spending in an already-growing economy:

Meanwhile, manufacturing has decreased since mid-2022 even as the raw numbers suggest otherwise, as another chart from St. Onge indicates:
“My colleague EJ Antoni found that manufacturing orders have been flat for at least 3 years, while consumer spending has actually been negative for those 3 years,” St. Onge notes.
St. Onge argues that GDP is another dodgy number, as I’ve explained here before, because people take GDP to mean what the economy is producing (“product”), whereas it includes a major and increasing factor in consumption—government spending:
Even that grandaddy of statistics, GDP, may be an illusion. Because GDP counts government spending as production.
Which, of course, it is not: it’s spending, not building. So our current $2 trillion deficit is, on paper, automagically boosting GDP by nearly 7%. But the spending isn’t making us richer—it’s making us poorer as physical resources get squandered.
St. Onge calls this phenomenon of inflation hiding economic contraction an “inflationary depression.” The (government-spending-induced) monetary inflation creates an initial euphoria, especially among investors, at the increasing value of their properties, which is soon followed by painful price inflation and then a recession or depression, St. Onge writes: “[H]istorically, inflationary depressions are hard to see for the simple reason that asset prices pump before consumer prices do. The affluent keep spending since their stocks soared and their house prices soared—sound familiar?”
QtR also cites gold bug Peter Schiff’s recent observation that the United States is “about to face the aftermath of a Fed-induced housing crisis.” Writing at the Mises Institute and cited by Schiff, Montana State University finance and economics student Jonathan Yen notes high interest rates have driven the home sales index to its lowest point this century—even lower than during the late-2000s housing crisis and the 2020 lockdowns. “U.S. pending home sales have dropped to historic lows not seen since the 2008 financial crisis, with a shocking 2.1% drop in May and a jaw-dropping 6.6% annual decline,” Yen writes. This is creating dangerous ripple effects, Yen notes: “With mortgage rates so high, banks and other investors are in massive trouble, facing severe cash shortages.”
The Fed’s rapid interest rate increases to fight Bidenflation have had a much more damaging effect on mortgage rates than even what happened during the run-up to the housing crisis, Yen writes:
The position of new home buyers in 2024 is unprecedented. Not only are prices at record highs, but the new generation of prospective home buyers can’t remember a time without cheap mortgages. During the steep decline in pending sales between 2005 and 2007, the average 30-year fixed rate mortgage only increased by about one percent. Since January of 2021, the average 30-year fixed rate has increased by 4.21 percent.
“New home sales crashed 11.3% MoM [month-over-month in May] (after April's 4.7% drop was revised up to a 2.0% MoM rise). That is the biggest MoM drop since Sept 2022,” ZeroHedge reported last month. “At the same time, the supply of available homes increased to 481,000, still the highest since 2008.” In June, “new home sales just confirmed the slowdown, dropping 0.6% MoM (notably below the 3.4% MoM expected) and also saw a major downward revision in May from -11.3% MoM to -14.9% MoM,” ZeroHedge reported last week. “That leaves new home sales down 7.4% YoY.”
“It is the slowest pace of home sales in any June since 1999, when the NAR began tracking the data,” Morningstar reports.
Higher mortgage interest rates have driven an increasingly large wedge between desirability and affordability. The Wall Street Journal reports:
Home prices hit a new high in June for the second straight month, the latest sign that the housing market is unaffordable to millions of Americans.
The spring home-buying season, usually the busiest time of year for the housing market, was a dud this year. Home sales declined in June for the fourth straight time on a monthly basis. The combination of high prices and elevated mortgage rates has made homeownership less attractive to renters and deterred current homeowners from moving.
But low inventory of homes for sale in much of the country is pushing prices higher. The national median existing-home price in June rose to $426,900, a record in data going back to 1999 and a 4.1% increase from a year earlier, the National Association of Realtors said Tuesday. Prices aren’t adjusted for inflation.
Although mortgage rates fell slightly in July, they are still much higher than what people are used to and remain an obstacle to buyers.
In response, Fortune magazine notes, builders are making the houses smaller, lowering their building costs so that they can increase the price per square foot, which economists call efficiency but normal people call “less house for a higher price”:
Home prices keep going up, yet new homes keep shrinking—and architects say they’ll just keep getting smaller, according to a July report by John Burns Research & Consulting (JBREC). Last year, about a quarter of new homes were downsized to cut costs, JBREC says, yet new-construction home prices increased by 2.5% in 2023, peaking at nearly $441,000 in August, U.S. Census Bureau data shows.
Housing prices are at a record high, indicating a shortage of supply, and sales have collapsed, yet the difficulty of selling has not driven prices down. That means, in short, that only people higher up on the income and wealth scales can afford a home. The Wall Street Journal story affirms that conclusion:
While the number of homes on the market has risen in recent months, it is still well below historical norms, which can lead to bidding wars for desirable properties. More than one-third of home sales in June went for more than their list price, according to real-estate brokerage Redfin. Sales of luxury homes rose in June compared with a year earlier, while sales of cheaper homes declined, which also pushed up the median price, NAR said.
Similarly, Morningstar notes that house purchases are now tilted toward the high end of the market and wealthier buyers:
Nearly 30% of properties were sold above list price, the NAR said, with homes receiving an average of 2.9 offers.
Sales of million-dollar-plus homes saw an uptick in June, the only increase among all price categories. Nationwide, sales of homes priced over $1 million rose 3.6% in June as compared with a year ago.
The combination of high prices and low sales has a well-known name when applied to the overall economy: stagflation.
Of course, although housing is a major component of people’s wellbeing, it is only one sector of the economy and does not prove that overall price inflation is still a problem. It is having an outsized effect on people of low to middle incomes, however, which helps explain why the public rates the economy less positively than analysts believe the numbers justify. The same is true of rising health care costs, the price of food, and the costs of other basics of life.
I think that the troubles in the housing market are emblematic of the current problems in the U.S. economy: low output suppressed by high energy costs and price inflation of business inputs, tighter credit which puts a further drag on output, increased borrowing by government and consumers alike at a much higher cost, and high government spending, which directs economic activity away from things people really want (indicated by the fact that they will pay for them voluntarily) to things that other people want them to want (indicated by the fact that they have to be forced to pay for them through taxes or debt, the latter being merely delayed taxes).
The real problem is excessive federal spending and regulation. The solution is to stop doing those things. Of course, that won’t happen before January 20, if then.
The economic indicators show that the U.S. economy is contracting and suggest that conditions might get much worse, all because of egregiously misguided government fiscal and regulatory policies and central bank monetary accommodation, St. Onge writes:
My base case has been that we’re repeating the 1970s disaster driven by out-of-control government spending and out-of-control Fed money printing. The official numbers are matching that almost to a tee.
But if, in fact, the real numbers are much worse—perhaps even as bad as voters and consumer surveys report—then we could be headed towards a proper Depression.
In fact, said St. Onge, in a YouTube video last week, “stagflation is already on our doorstep.”
I believe that St. Onge is right. Numerous economic indicators suggest that the U.S. economy is contracting and that conditions might get much worse, all because of egregiously misguided government fiscal and regulatory policies and years of central bank monetary accommodation.
If the Fed starts lowering interest rates in September as expected, it will probably not do much to improve economic conditions, especially if it is a small cut of just 0.25 percent as was expected until yesterday’s dismal jobs report and stock market selloff. In addition, the markets have already priced in a rate cut several times now, on (consistently disappointed) expectations of cuts in previous months. If the Fed stops selling securities, having already slowed those sales in recent months, it will have a money-loosening effect. Banks may counter that, however, by increasing their reserves at the Fed, as they signaled in June.
That leaves fiscal and supply-side factors as the big influences on the economy. Those are in the exceedingly clumsy hands of the federal government. Cutting tax rates, spending, and regulation would get the economy going again. Nothing along those lines is going to happen before January 20, however, and spending cuts are unlikely even then. The future of the American economy depends entirely on whether voters decide to change course this fall.